What does the bond investor do with rising interest rates? – Part 1
(Publication Date: February 24, 2017)
De Nederlandstalige versie is op 6 maart 2017 verschenen op www.iex.nl.
Introduction
In 2015 we wrote a series of articles in which we wondered what the bond investor should do in an environment where interest rates do not structurally fall, but instead rise over a long period of time. Like many, we were on the early side, but now this question has become extremely relevant.
The risk of an interest rate rise
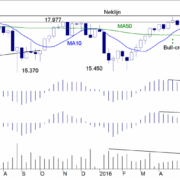
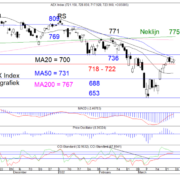
Figure 1 shows (top) the price development of a government bond which is issued by the Dutch government in 2007 with a term of 30 years at the time. The remaining term is now 20 years and the loan is still considered long term. At the bottom of the figure one will find the development of the 10-year rate for €-denominated European government bonds.

Figure 1.
In the graph we drew red vertical lines to distinguish the periods when interest rates rose from the periods in which interest rates fell. It needs to be noted that the bond is sensitive to the interest rate of the same maturity, now 20 years. That is not the same interest as the 10-year rate we used in the graph.
Structures and interest rate spreads
The longer the duration, the smaller usually the extremes in movements of interest rates will be. The development of long-term rates is an expression of the expectation of the markets as to the future development of short term interest rates. Market participants will always ask themselves whether the ECB and the Fed and other central banks will raise or lower interest rates in the (near) future. If one expects that interest rates will rise in the future, then yields on the long end of the bond market will lead the way by rising earlier. But investors also know that interest rates over a period of 30 years from time to time will drop again. At the peak of the interest rate cycle therefore 30-year yields will have risen less high than the 10-year rate. This is referred to as an abnormal, also called inverse situation. Normally, the 30-year interest rate should be higher than the 10-year bond yield as the risk that you will lose your money after 30 years is always higher than the same risk when having a term of 10 years.
Back to the graph in figure 1
What the graph does show is that an increase in interest rates will lose the bond investors money. If interest rates rise the price of the bond drops. This calls for a nuance. The price declines mainly take place in bonds with long to very long terms.
The graph also shows something else: the bond price is at a support level and a real breakthrough downward has not happened yet. The 10-year yield however has already broken through the resistance of 0.6%. Where 10-year yields rose further in recent weeks, the 30-year interest rate that did not.
And finally, the graph also shows once again that as yet no bottom pattern in the interest rate can be seen. To date, the tops again and again have been lower (lower graph) than the each previous top and bottoms and again and again came out lower than the foregoing bottoms.
The end of QE
But graphs are not everything. Last week an ECB member announced that he believes the European QE-program is nearing its end. And a member of the Fed in the U.S. went further by saying aloud that the Fed is close to the point to shorten its balance sheet. Virtually every analyst agrees that the European and American central banks face a normalization of their policies. In Europe, this means little in the short run, as Draghi has indicated that he will keep buying bonds until the end of this year. But the amount is less and whether he can continue this program in 2018 is becoming less likely. The Fed has already stopped buying loans, but so far has replaced the loans it has in its portfolio when they matured. Reducing the balance sheet means that they will also stop replacing loans. If that happens, then the potential inflationary risk from all that cheap money is reversed. After all, the Fed then pulls previously created money back out of the economy through the repayments on the loans it holds.
“When QE is stopped, interest rates will rise again”
That is the prevailing opinion amongst analysts. But whether this will be true is questionable. The expectation that the end of the QE program will lead to an increase in interest rates, is a self-fulfilling prophecy. If investors expect it, they sell long-term bonds, so the price of these bonds drops and thus interest rates rise. But then once the QE program is stopped and the central banks have cut their balance sheets again, it does not necessarily mean that the interest rate will keep on rising. For example, an increase in the velocity of money in the system would counteract the pressure on interest rates and could even make rates fall again. But if discontinuation of the QE-program is associated with an increase in inflation (and inflation expectations keep rising), then interest rates will probably continue to rise.
The development of interest rates is like the course of a supertanker
One should not expect interest rates to continue to rise for years in a straight line. The development of interest rates is as the momentum of a supertanker. It takes a long time before you have reversed the direction of a supertanker. One must therefore first expect the development of a large bottom pattern. And to this end it is interesting to look at US yields.
The 10-year yields in the $-sphere; long term trend

Figure 2.
Figure 2 shows two graphs on a monthly basis. The black graph, in the top, shows the development of the 10-year yield on US government bonds. And the blue graph at the bottom is the development of the 30-year yield on US Treasuries (CBOE). Line A, the red horizontal line in both graphs, is the most important line for the moment. It shows a considerable resistance, which has not yet been broken in both cases. This resistance coincides with the peak rate in 2015. It could well be that interest rates will go down again from this first level of resistance towards the bottom that was reached in both cases at the end of 2014. If this scenario manifests itself, we assume that the decline will take some time. This is a monthly chart; it can take several months before the fall has materialized. But we opt for a second, more likely scenario and that is that the current respite in the course of the next few weeks will be terminated with an outbreak upwards, with the interest rates rising to line B, the green horizontal line(s) in the figure. But then the supertanker again comes around the corner. From that level a sharp decline in interest rates is quite conceivable, back to the lows of 2012. Remember that Ms. Yellen is to be replaced by the end of this year!
Macro-economic reasoning
It’s speculation, but a reasonable macroeconomic scenario, which would explain our most likely scenario, is the idea that the Trump-administration will for a while keep-up the optimistic note of markets in general, but that in due course the chaos surrounding the Trump-administration will start to disappointment investors and will ultimately lead to an economic downturn or even a new recession.
Conclusion
Our first conclusion is that the supertanker is turning. Interest rates will ultimately turn the structural down trend into a long term uptrend in coming years, albeit in fits and starts.
Next week
And thus the next question is, how a bond investor can arm himself against an environment of structurally rising interest rates? The piece, that you have just read, is our introduction to this quest. Next week we will discuss some bond funds, asking ourselves whether they are or are not able to take advantage of rising interest rates.
The Hague, 24 February 2017
Gijsbrecht K. van Dommelen
Vladeracken Vermogensbeheer
Disclaimer
The author is responsible for the investment policy at Vladeracken BV, an asset management company licensed by the AFM. Vladeracken invests and / or has invested in the securities discussed herein on behalf of its clients. This piece is not an investment advice. Whoever invests in the securities discussed herein and in accordance with the methodology and arguments discussed, or wants to invest accordingly does for his or her own accountability and risk. In this context, the author and Vladeracken BV disclaim all responsibility for the contents of this article. The securities and methods discussed represent a high risk.